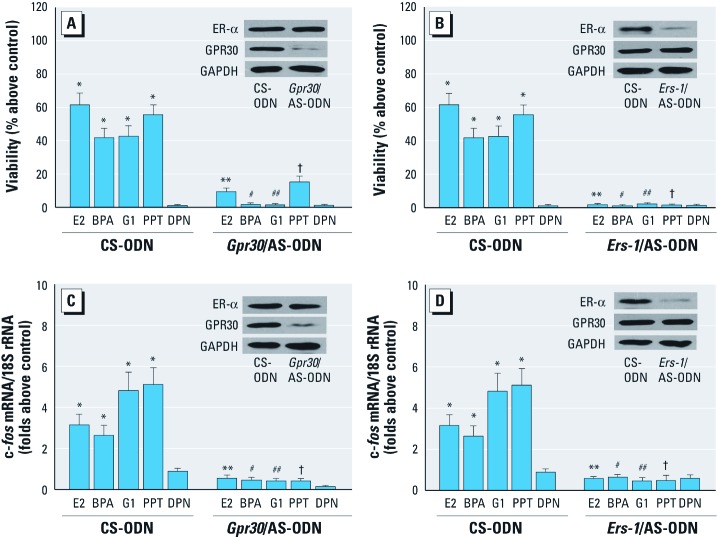
Figure 4.
Silencing of Gpr30 or Ers-1 inhibited BPA-induced cell proliferation (A, B) and fos gene expression (C, D) in GC-1 cells transfected with control scrambled (CS)-ODN and GPR30/AS-ODN (A, C) or with CS-ODN and Ers‑1/AS-ODN (B, D) and treated with E2 (10–9 M), BPA (10–9 M), G1, PPT, or DPN (each at 10–7 M). Cell proliferation was determined by MTT assay (A, B), and fos mRNA levels were examined with real-time RT-PCR (C, D), as described in “Materials and Methods.” Values shown (mean ± SE) represent results of three independent experiments performed in triplicate; the control value was set as 1. *p < 0.05, compared with control. **p < 0.05, compared with E2. #p < 0.05, compared with BPA. ##p < 0.05, compared with G1. †p < 0.05, compared with PPT.

