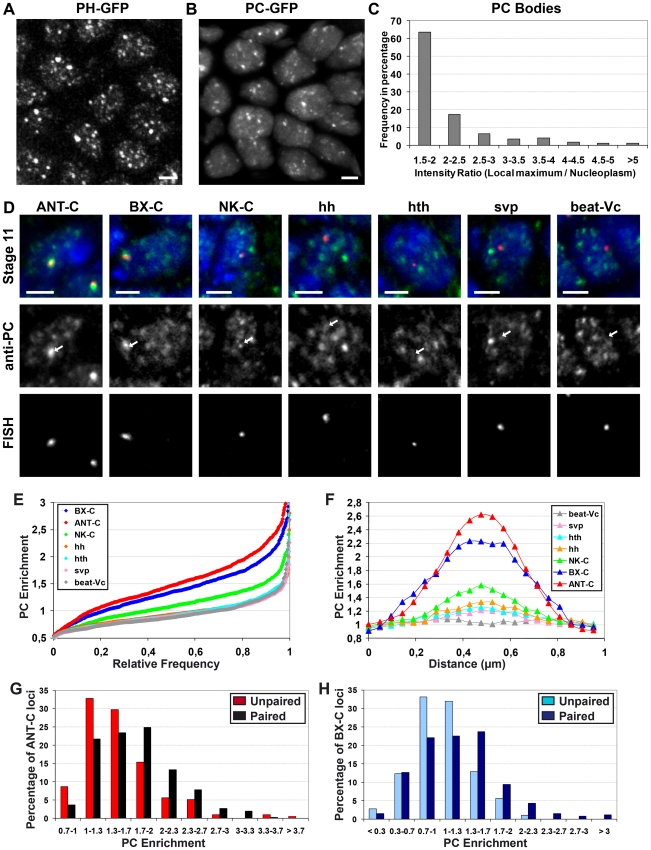
Figure 1. PC enrichments within PC bodies depend on the length of genomic domains coated by PC.
A–C: Non-normal distribution of PC enrichment within PC bodies. 3D images of embryos expressing PH-GFP (A) or PC-GFP (B) show intense and faint PC bodies. The scale bar is 2 µm. Histogram showing the distribution of PC enrichment within PC bodies (C). D–H: The amount of PC within a PC body depends on the genomic length of regions bound by PC. 2D images of Immuno-FISH experiments performed with probes located in large (∼400 kb: ANT-C and ∼340 kb: BX-C), medium (∼200 kb: NK-C) or small (∼50 kb: hh, hth and svp) genomic regions coated by PC, as well as probes directed against beat-Vc which is not coated by PC (D). The scale bar is 2 µm. Cumulative histograms of PC enrichment measured within the FISH volumes (N>500 for each FISH probe) (E). 1-µm profiles of PC enrichment along lines crossing their corresponding FISH volumes (N>57 for each FISH probe) (F). Histograms showing that homologous chromosome pairing increases the enrichment of PC within PC bodies containing ANT-C (p<0.001, KS test with N>190) (G) or BX-C loci (p<0.001, KS test with N>175) (H).

