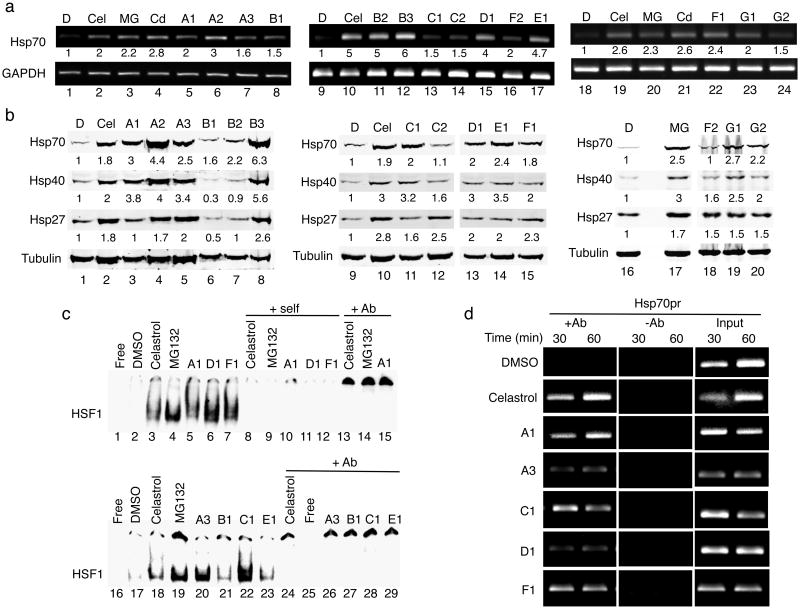
Figure 2. The small molecule PRs induce Hsp expression by activating HSF-1.
(a) HeLa cells were treated with DMSO, celastrol (Cel, 3 μM), MG132 (MG, 10 μM), CdCl2 (Cd, 50 μM) and selected PRs for 4 h. Similar results were obtained in two independent experiments. Densitometric measurements of Hsp mRNA levels normalized to GAPDH in relation to control DMSO-treated cells were performed using ImageJ software. (b) Western blot analysis of HeLa cells treated with DMSO, celastrol (Cel, 3 μM), MG132 (MG, 10 μM) and selected PRs. Fold induction was calculated as the ratio of normalized Hsp values between a compound-treated sample and the untreated control. Densitometric measurements of Hsp levels normalized to tubulin were performed as in (a). (c) Gel mobility shift assay was performed with a [32P]HSE oligonucleotide and HeLa cell whole cell extracts. DMSO: lanes 2 and 17; celastrol (3 μM): lanes 3 and 18; MG132 (10 μM): lanes 4 and 19; small molecule PRs (10 μM): lanes 5-7 and 20-23. Lanes marked self (lanes 8-12) contained a 200-fold molar excess of unlabeled complementary oligonucleotide. Lanes marked +Ab (lanes 13-15 and 24-29) contained a HSF-1 antibody. (d) HeLa cells were treated with DMSO, celastrol (3 μM) and selected PRs (10 μM) for 30 and 60 min and then chromatin was cross-linked, harvested, and immunoprecipitated with HSF-1 antibody (+Ab). The samples were then analyzed by PCR with primers specific for the Hsp70.1 and the dihydrofolate reductase (DHFR) promoters. The controls include input DNA and a no antibody control (-Ab).

