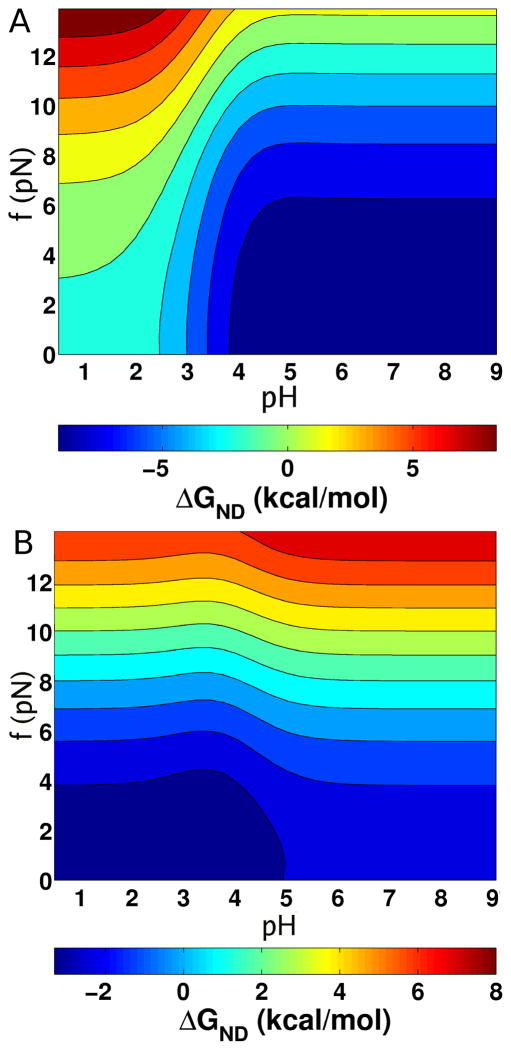
Figure 2.
Force-pH phase diagram. (A) The [f, pH] diagram displays ΔGND(f, pH) for CI2 at a simulation temperature of 302 K. The solid lines correspond to lines of iso-stability. The scale for ΔGND(f, pH) is given below. (B) Same as (A) except it is for protein G at a simulation temperature of 317 K.

