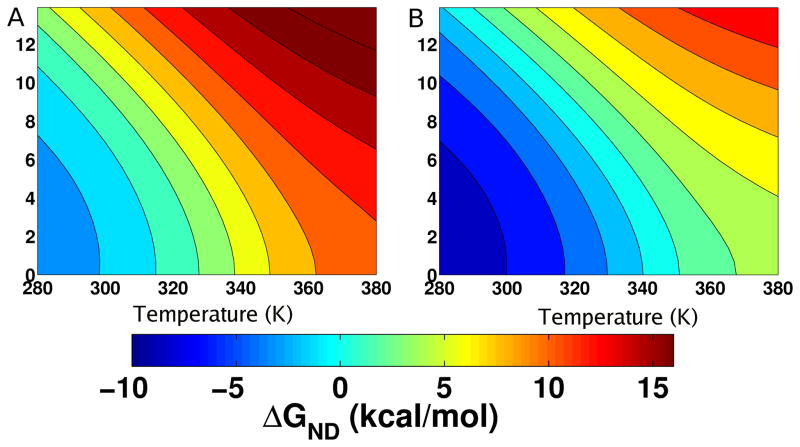
Figure 3.
Force-temperature phase diagram for CI2. (A) Contours of this phase diagram at pH=1.0 are lines of iso-stability in ΔGND(f,T). Blue regions correspond to a thermodynamically stable native state while red corresponds to the unfolded state. (B) The [f,T] diagram is for pH=3.5. Enhanced stability at higher pH is reflected in large [f,T] regions in which the native state is stable.

