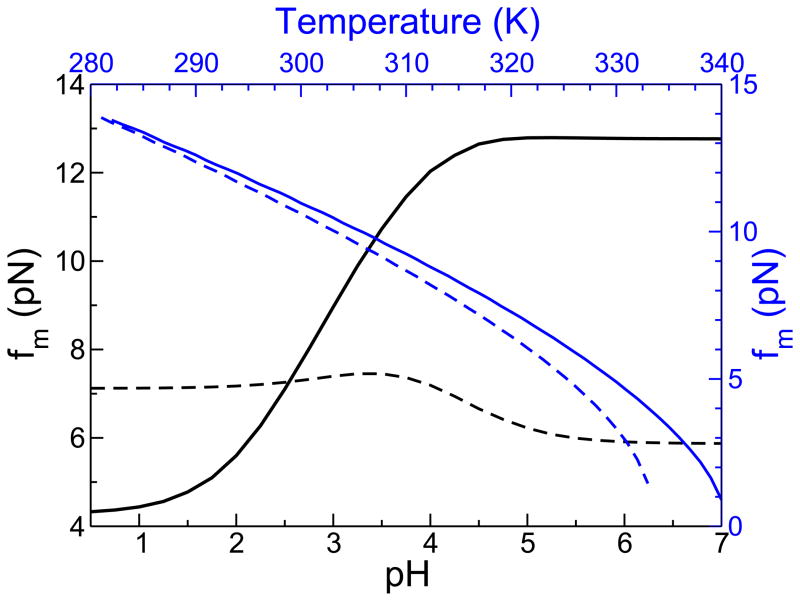
Figure 4.
The force midpoint at various temperatures and pH. The temperature scale is on top in blue and the corresponding scale for fm is on the right. Solid lines are for CI2 and the dotted lines are for protein G, with blue corresponding to temperature and black to pH changes. Unless otherwise stated, the solution conditions for CI2 are 302 K and pH 3.5, and for protein G the conditions are 317 K and pH 2.3.

