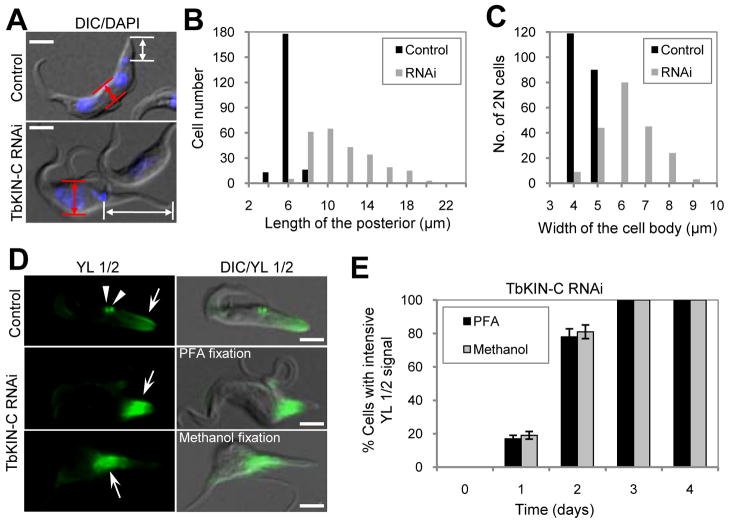
Figure 6. Effect of TbKIN-C RNAi on the distribution of tyrosinated α-tubulin.
(A). TbKIN-C RNAi resulted in extension of the posterior of the cell. Arrows show the distance between the kinetoplast and the posterior end of the cell. Bars: 5 μm. (B) The length of the posterior, from the kinetoplast to the posterior end of the cell, was measured by ImageJ software and plotted. A total of 200 cells were measured for both the control and RNAi cells. (C). The width of the middle portion of 2N cells (~200) was measured by ImageJ and plotted. The middle portion of the cell was defined as the middle between the two nuclei. (D). Cellular distribution of tyrosinated α-tubulin in TbKIN-C RNAi cells. Cells were fixed either with paraformaldehyde (PFA) or with cold methanol and stained with YL 1/2 antibody, which stains tyrosinated α-tubulin. Arrows point to YL 1/2 signal and arrowheads indicated the basal bodies in the control cell. Bars: 5 μm. (E). Percentage of TbKIN-C RNAi cells with intensive YL 1/2 staining in the posterior end of the cell.

