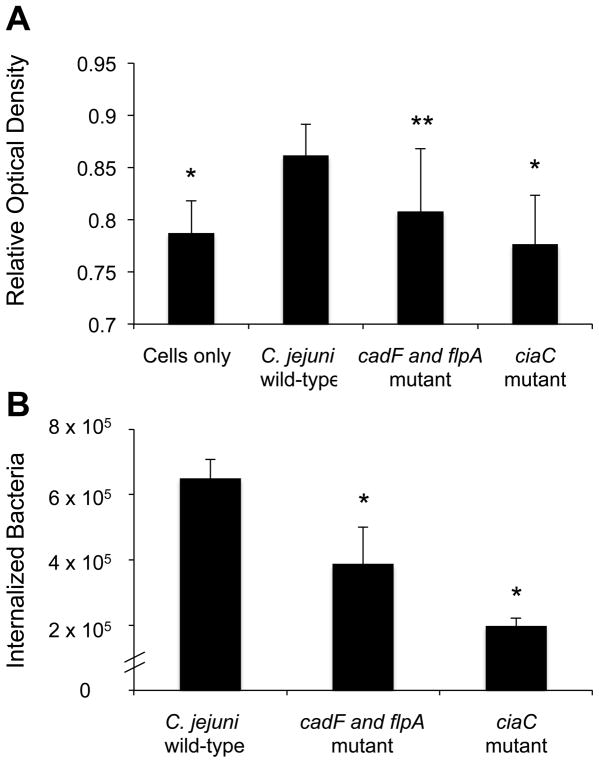
Fig. 5.
Rac1 is activated in INT 407 cells in response to C. jejuni infection. INT 407 cells were inoculated with the C. jejuni wild-type strain, cadF flpA mutant, and ciaC mutant. A) Whole cell lysates were processed after 15 minutes of incubation and analyzed for activated Rac1 by G-LISA™. The mean ± standard deviation of total active Rac1 is indicated in Relative Optical Density. The data shown represent at least 10 samples of each condition analyzed in duplicate. B) C. jejuni invasion of host cells as determined by gentamicin protection assay. Values represent mean ± standard deviation of internalized bacteria/well of a 24-well tissue culture tray. The asterisks indicate a significant difference (P < 0.01) in internalization as compared to the wild-type strain. The asterisks indicate a significance difference (*P < 0.01, **P < 0.05) in Rac1 activity for the wild-type strain versus uninoculated cells and cells inoculated with the C. jejuni ciaC and cadF flpA mutants.

