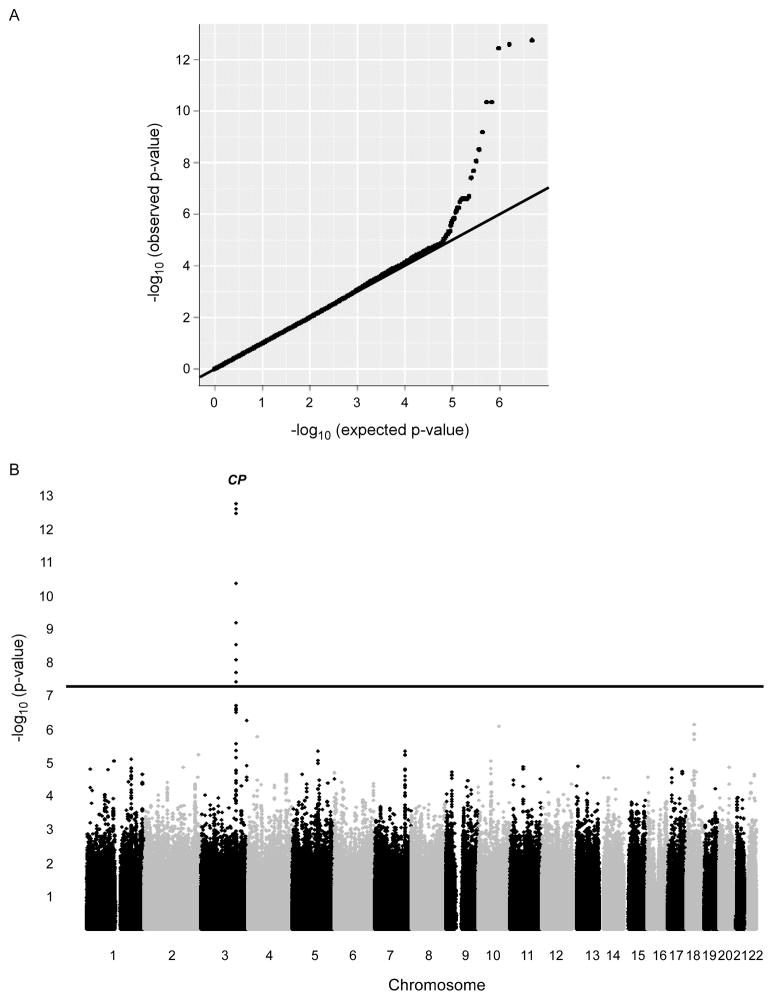
Figure 4.
Q-Q and Manhattan plots from GWAS for serum ceruloplasmin levels. The p-values obtained from SNPs in the GWAS analyses deviate from that expected by chance, suggesting that a subset of these signals indicate true associations (A). Serum ceruloplasmin levels in this study population (n = 2,647) are controlled predominantly by locus on chromosome 3 containing the CP gene (B).

