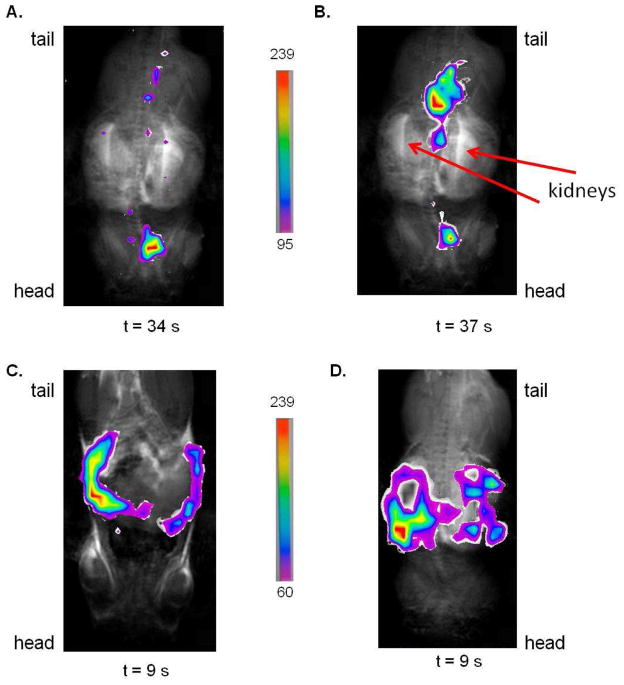
Figure 5. 13C Imaging in vivo.
Images (A), (B), (C), and (D) are overlays of 13C FISP images (60° flip angle) in false color taken of different injections of hyperpolarized diethyl succinate over the proton image of the mouse using the same 6 cm FOV, central slice placement and slice thickness. To remove noise from FISP images, only pixels above a certain threshold were used. The scales corresponding to each set of false color images are seen. The time values below the images is the amount of time in seconds after the injection of the hyperpolarized compound that the 13C image was taken. Image (A) and (B) are 13C FISP images of two different i.v. injections of hyperpolarized diethyl succinate. Based on the location of the 13C image in images (A) and (B), some of the hyperpolarized compound and its metabolites can be found to be localized around the region of the heart. In image (B), the majority of the hyperpolarized signal is found posterior to the kidneys in the region of the bladder and ureters. Images (C) and (D) are overlays of 13C FISP images of two different i.p. injections of hyperpolarized diethyl succinate. Based on the location of the 13C images, the hyperpolarized compound seems to be retained in the peritoneum with i.p. injection in the time window of the image (9 s).

