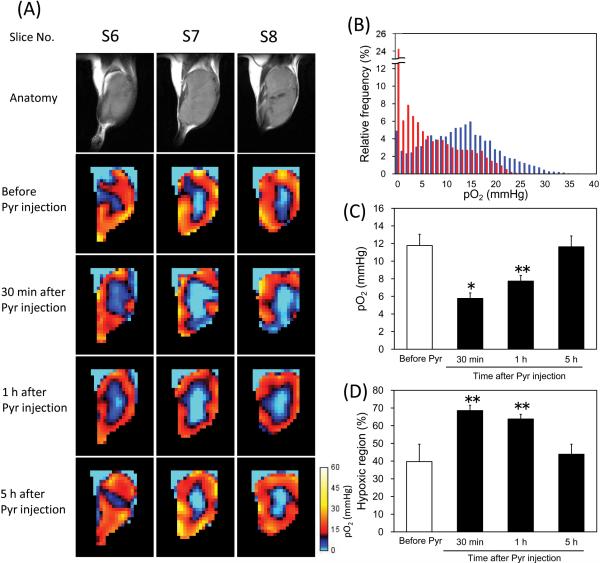
Figure 2.
Non-invasive monitoring of tumor pO2 by EPRI and effects of pyruvate injection. (A) T2-weighted anatomical image of a representative SCC tumor–bearing mouse, and the corresponding pO2 maps measured before, 30 min, 1 h, and 5 h after [1-13C]pyruvate injection. The adjacent center three slices of the 3D images were displayed, and the every slice has 2 mm thickness. (B) Frequency histogram of the tumor pO2 shown in (A) before (blue) and 30 min after (red) pyruvate injection. (C) Median pO2 in the tumors, and (D) percentage of the hypoxic region (pO2 < 10 mmHg) in the tumors. Each value in (C) and (D) indicates the mean ± SEM of 4 mice. * P<0.01, ** P<0.05, compared with before pyruvate injection.

