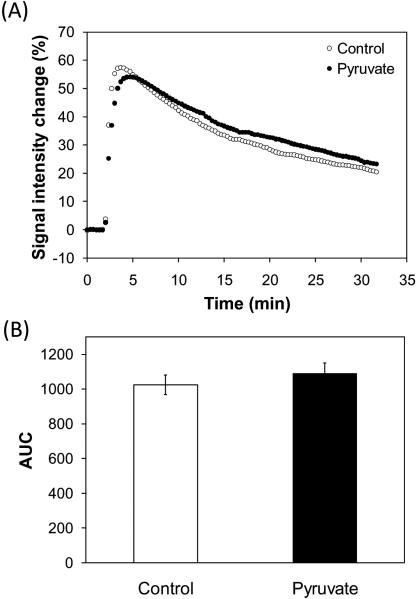
Figure 4.
Tumor perfusion measurements by DCE-MRI. (A) Signal intensity change in T1-weighted images of SCC tumors by Gd-DTPA injection. Gd-DTPA (234.5 mg/kg body weight) was intravenously injected to the mice 2 min after starting the scan. The control mice (n = 4) didn't receive [1-13C]pyruvate injection. The pyruvate group (n = 4) received [1-13C]pyruvate injection 30 min before DCE-MRI. (B) Area under the curves. Each value represents the average of 4 mice and error bars represent SEM. There was no significant difference between the control group and the pyruvate group.

