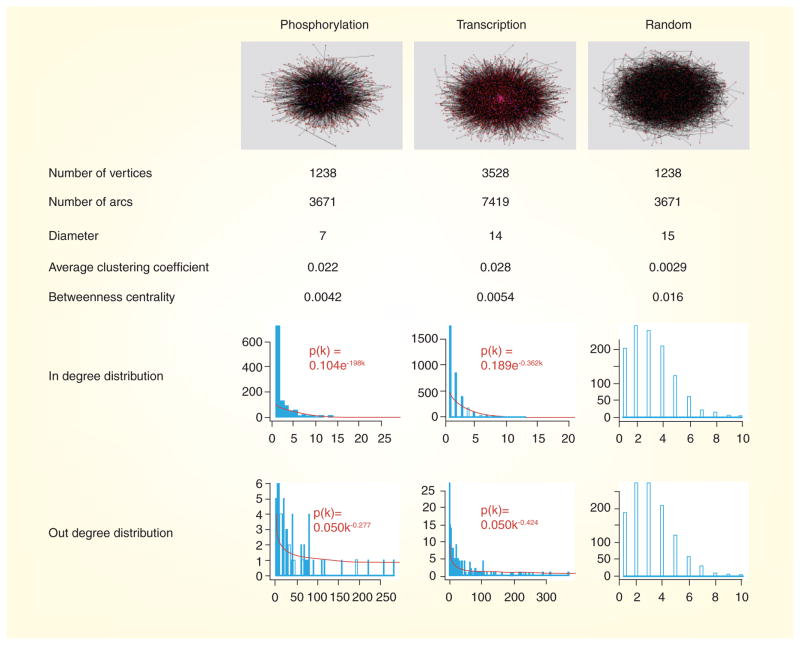
Figure 2. Network comparisons.
The yeast phosphorylation network shares similar topological features with the transcription factor-binding network, but differs significantly from a random network permutated from the phosphorylation network. Regulators (kinases or transcription factors) are colored magenta, targets red and regulation interactions black. Both the phosphorylation and transcription factor-binding networks have power law in-degree distributions and exponential out-degree distributions, with many other comparable topological parameters between the two networks.
This figure was generated using the program Pajek [62].

