
Figure 8.
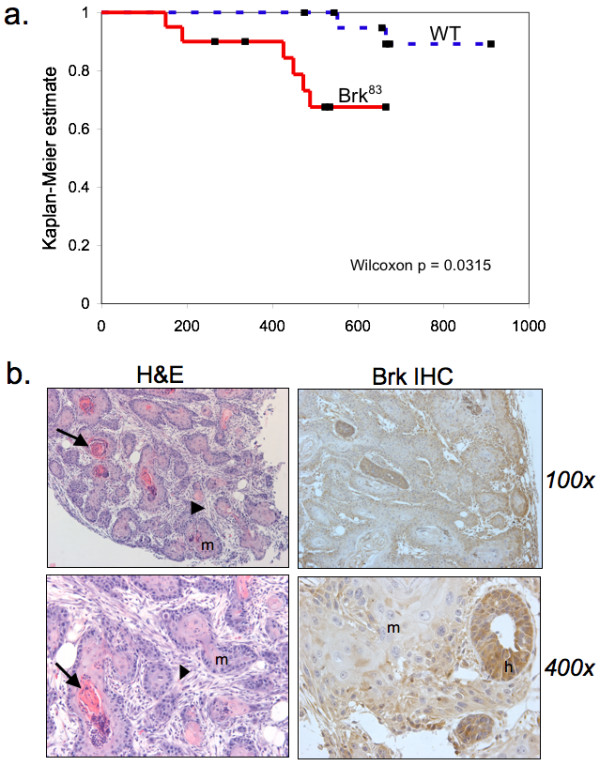
WAP-Brk mice develop mammary tumors. A, Kaplan-Meier estimate for the tumor cohort desribed in Table 1 (tumor free mice vs. days). B, Representative images of a tumor from WAP-Brk mouse B257. Left: H&E sections of a tumor in the R2 mammary gland. Right: Transgene expression in the same tumor. (Arrow, keratin pearl; arrowhead: fibrotic stroma; h, hyperplastic duct; m, squamous metaplasia.)