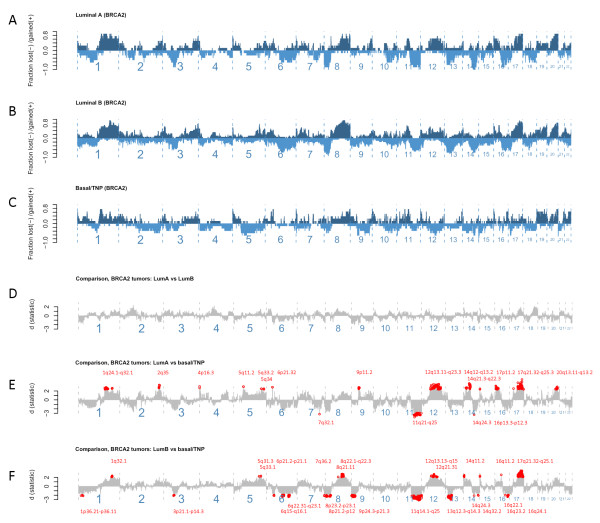
Figure 1.
Event-frequency plots for copy-number alterations and comparison between phenotypic subgroups of BRCA2 tumors. (a) The proportion of gains (positive, dark blue) and deletions (negative, light blue) plotted on y-axis for each genomic location ordered from p- to q-arm on x-axis left to right in BRCA2 tumors displaying luminal A (n = 8), and (b) luminal B (n = 16), and (c) basal/TNP phenotypes (n = 8). (d) Comparison in copy-number alterations with significance levels (d) shown on y-axis and differences below a false-discovery rate of 0.05 indicated in red (cytoband locations) derived from comparisons between BRCA2 tumors displaying luminal A and luminal B phenotypes, (e) between BRCA2 tumors displaying luminal A and basal/TNP, and (f) between BRCA2 tumors displaying luminal B and basal/TNP.

