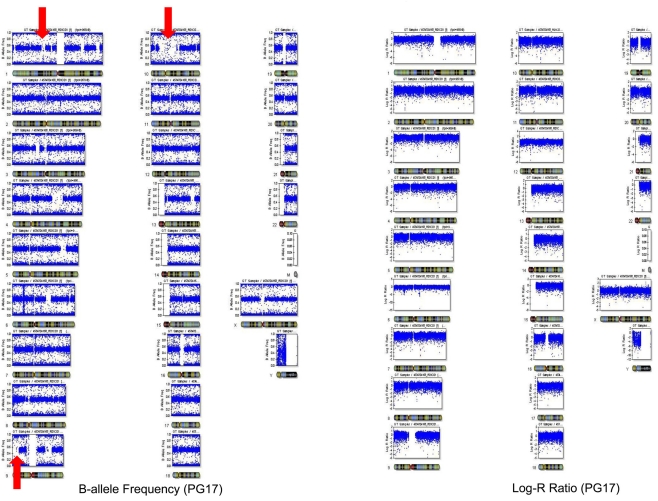
Figure A3.
Plot of the B allele frequency (a measure of heterozygosity/homozygosity) and the log R ratio (a measure of signal intensity that relates to copy number variations) using Illumina BeadStudio. The plot of B allele frequency shows that there are significant stretches of homozygosity across many chromosomes (see red arrows). However, this was not associated with a shift in log R ratio at these locations suggesting that this was not due to big deletions but probably to inbreeding of her ancestors with distant relatives that resulted in higher homozygosity.

