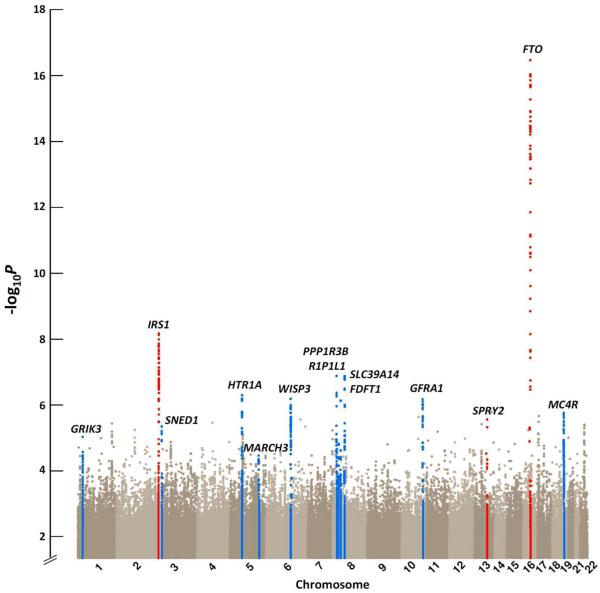
Figure 1.
Manhattan plot showing the significance of association with body fat percentage for all SNPs in the stage 1 meta-analysis of all individuals (n=36,626). SNPs are plotted on the x-axis according to their position on each chromosome against association with body fat percentage on the y-axis (shown as −log10 P-value). The loci highlighted in blue are the 11 loci that reached an association P value < 10−6 in the stage 1 meta-analysis of all individuals, Europeans, men, or women, and were taken forward for follow-up analyses, but did not achieve genome-wide significance (P < 5 × 10⁻⁸) in the meta-analyses combining GWAS and follow-up data. The three loci coloured in red are those that reached genome-wide significant association (P < 5 × 10⁻⁸) in the meta-analyses combining GWAS and follow-up data.

