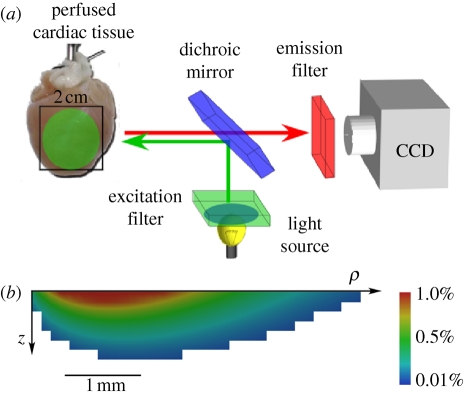
Figure 4.
Optical mapping of surface spatio-temporal activity. (a) Epi-fluorescence optical mapping of Langendorff perfused heart. (b) Simulation of the subsurface tissue contribution to the surface optical signal for Di-4-ANEPPS, from a rotationally anisotropic transmural slab of depth 5 mm and radius 10 mm. Scale bar indicates the percentage contribution of each pixel to the total signal recorded from the top left pixel on the epicardial surface.

