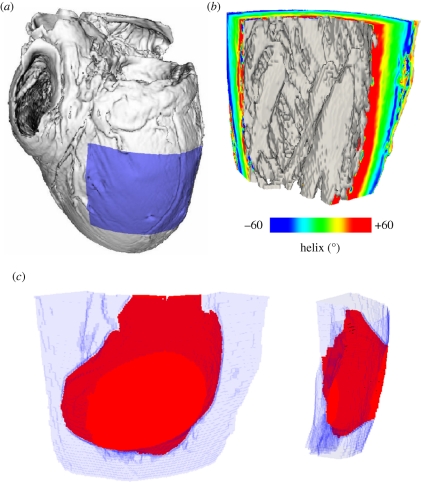
Figure 9.
(a) Visualization of the human DT-MRI dataset geometry (see acknowledgements). The shaded area indicates the spatial extent of the wedge extracted from the left ventricular free wall. (b) View of the wedge geometry and fibre helix angle from an endocardial aspect. (c) Wavefront isosurface at 60 ms following epicardial excitation of human left ventricular free wall. The spatial extent of the wedge geometry is indicated in light blue; excited tissue is in red.

