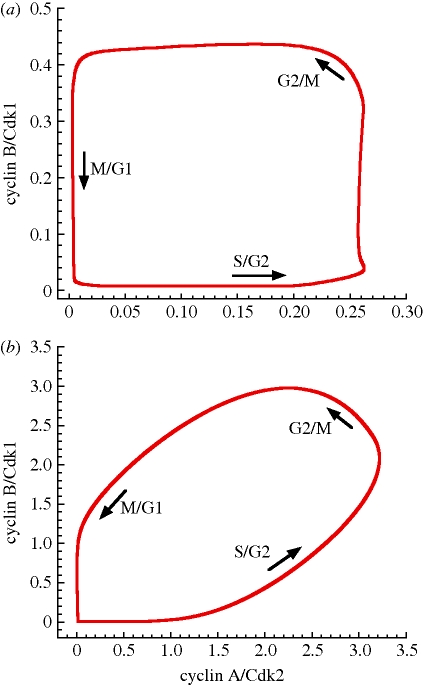
Figure 5.
Limit cycle oscillations in the Cdk network. The oscillations of figure 4a,b correspond to the evolution to a limit cycle shown as a projection onto the cyclin A/Cdk2 versus cyclin B/Cdk1 phase plane for the 39-variable model (a) and for the 5-variable model (b). Arrows show the direction of movement on the limit cycle. Parameter values are as in figure 4.

