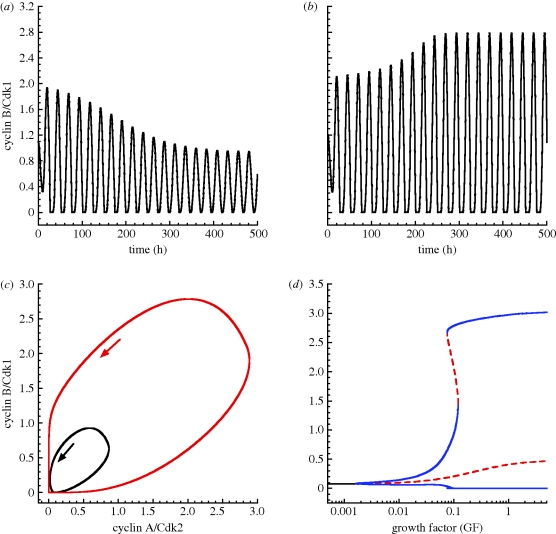
Figure 8.
Birhythmicity in the skeleton model for the Cdk network driving the mammalian cell cycle. The coexistence of two stable oscillations can be observed in the model when GF = 0.1 µM (see the bifurcation diagram in (d)). Initial conditions: the level of cyclin B/Cdk1 is equal to 1.1 µM in (a) and for the black curve in (c), or 1.2 µM in (b) and for the red curve in (c). The bifurcation diagram in (d) shows the level of cyclin B/Cdk1 as a function of GF. Black curve, stable steady state; red dashed line, unstable steady state or the envelope of unstable oscillations; blue curve, envelope of stable oscillations. The Cdk network tends to a stable steady state for a low level of GF, and to a unique oscillatory regime at high levels of GF. At intermediate levels of GF (close to 0.1 µM), the Cdk network can evolve to either one of two stable oscillations (birhythmicity). In (a)–(c), the initial conditions for the other variables of the model are equal to 0.01 µM. Other parameter values are the same as in table 2.

