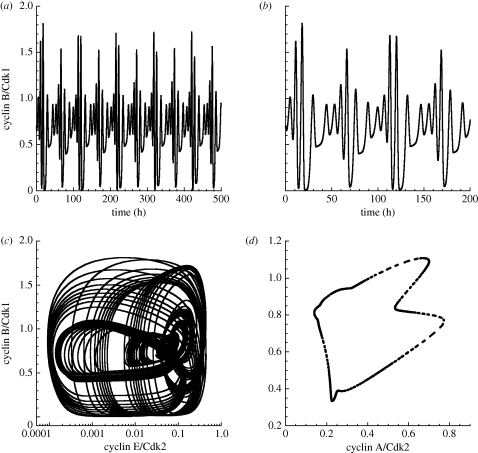
Figure 9.
Quasi-periodic oscillations in the skeleton model for the Cdk network. (a) Time evolution of cyclin B/Cdk1. (b) Enlargement of a portion of the time series shown in (a). (c) Phase plane trajectory. (d) Poincaré section showing the levels of cyclin B/Cdk1 and cyclin A/Cdk2 corresponding to the successive passages of cyclin E/Cdk2 through a maximum. Parameter values are: GF = 0.01 µM, vsd = 0.01 µM h−1, Vdd = 0.7 µM h−1, V1e2f = 3.1 h−1, V2e2f = 2 h−1, vse = 0.6 h−1, Vde = 1 h−1, vsa = 0.5 h−1, Vda = 0.7 h−1, Kda = 0.25 µM, vsb = 1.06 h−1, Vdb = 0.8 h−1, Kdb = 0.25 µM, V1cdc20 = 1.185 h−1, V2cdc20 = 1 µM h−1, K1cdc20 = K2cdc20 = 0.01 µM, Cdc20tot = 2 µM. Other parameter values are listed in table 2.

