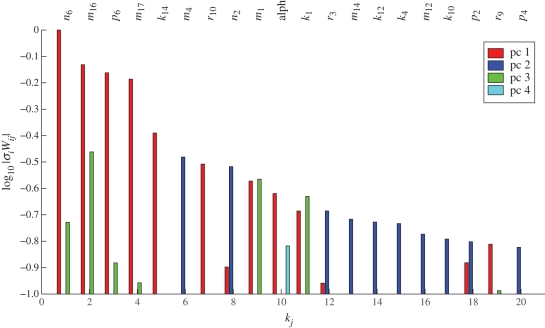
Figure 6.
Power sensitivity spectrum of the Locke model. Each group of bars corresponds to the values of log10|σiWij| for a parameter kj. These are only plotted for those i for which log10|σiWij| is significant (here that is i = 1–4). The parameters kj are ordered by maxi=1−4 log10|σiWij| and only 20 most sensitive ones are plotted. Not taking into account Hill terms g2 and g7 (for reasons outlined in the main text), parameter p6 has the highest maxi=1−4 log10|σiWij|. Only seven other parameters (parameters up to and including m1) have sensitivity higher than 30 per cent of the maximum, and they will be candidates for temperature-sensitive parameters.

