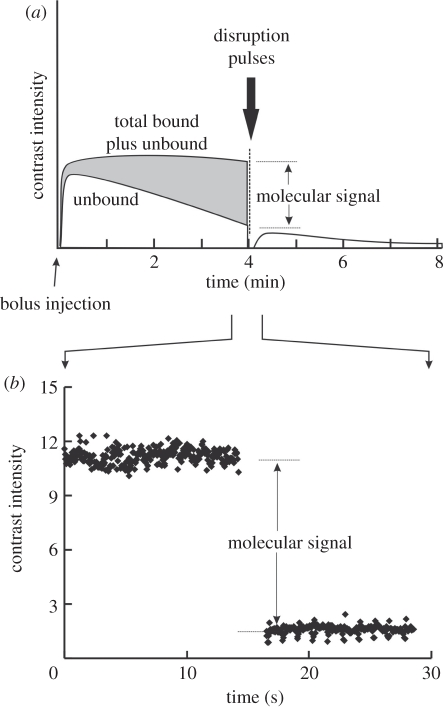
Figure 14.
(a) Schematic of a molecular imaging experiment. At time t = 0 a bolus of contrast is injected in the tail vein of the mouse. As the signal due to bound contrast increases the unbound agent is cleared by the lungs, liver and spleen. At 4 min a disruption pulse eliminates the contrast in the imaging plane after which only circulating MBs are detected. The difference between pre- and post-disruption is a representation of the ‘molecular signal’. (b) Actual signal for a breast cancer orthograft (MDA-MB-231) following a 50 µl injection of VEGFR-2 targeted MBs (1.02 × 109 MB ml−1).

