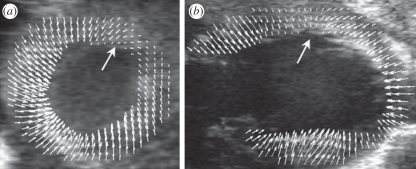
Figure 17.
Displacement maps for a day 1 post-MI mouse heart superimposed onto the original ultrasound images to provide a visual representation of the relationship between anatomy and function. (a) Mid-ventricular, short-axis view. (b) Long-axis view of a second day 1 post-MI mouse heart. Wall motion defects, involving reduced regional displacement, are indicated with large arrows. Adapted from [112].

