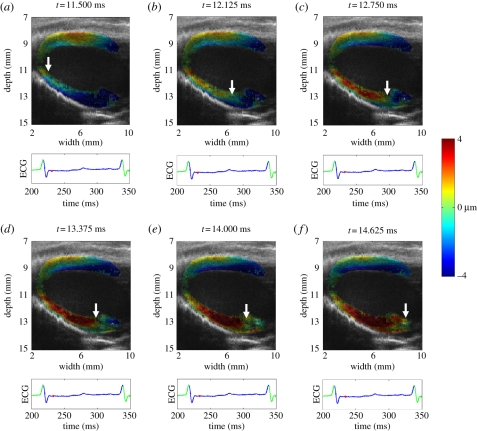
Figure 19.
Sequence of electromechanical displacement images every 0.625 ms in a normal mouse left ventricle during sinus rhythm. The displacements are colour-coded and overlaid onto the B-mode images. Positive displacements (in red) represent upward motion, which negative displacements (in blue) represent downward motion. The arrows indicate the propagation of the electromechanical activation from the apex to the base along the posteriolateral wall.

