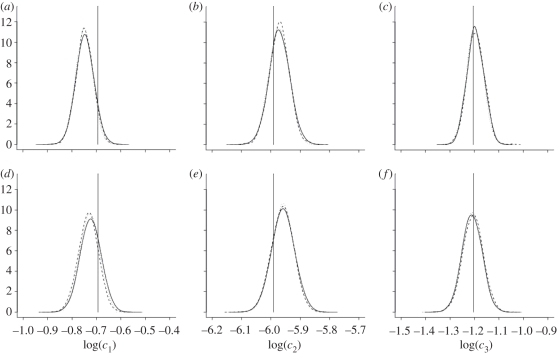
Figure 1.
Marginal posterior distributions based on the output of the PMMH scheme for the SKM (solid), CLE (dashed) and CLE with bridging strategy (dotted) using synthetic data generated from the Lotka–Volterra model with (a–c) σ2 = 10 and (d–f) σ2 = 200. Values of each log(ci) that produced the data are indicated.

