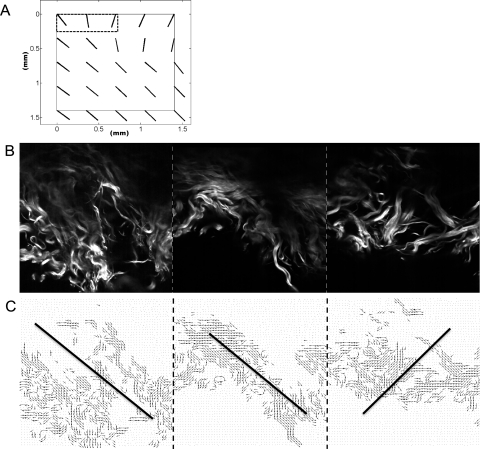
Figure 5.
Comparison between SALS and multiphoton microscopy results of a sample of porcine sclera. (A) The SALS plot of the porcine scleral slice which encompasses a depth between 0 and 70 μm. The black-dashed box at the top left corner indicates the three locations (the three small vectors) imaged with the multiphoton microscope. (B) A set of three adjacent multiphoton images (SHG) at 50-μm depth. Images were taken at 5-μm intervals (from 0 to 70 μm). (C) A quiver plot generated based on the microscopic images in (B). Small vectors indicate the fiber directions at each pixel. Solid lines: the mean orientations in each image. Note that the three microscope images, with a 350-μm2 field of view for each, were pieced together in (B) and (C) to show the whole fiber structure. (B, C, dash lines) The separation of each adjacent image. For validation, the vectors shown in (C) were averaged across all depths from 0 to 70 μm (C, solid lines) and compared to the vector value as reported from SALS.

