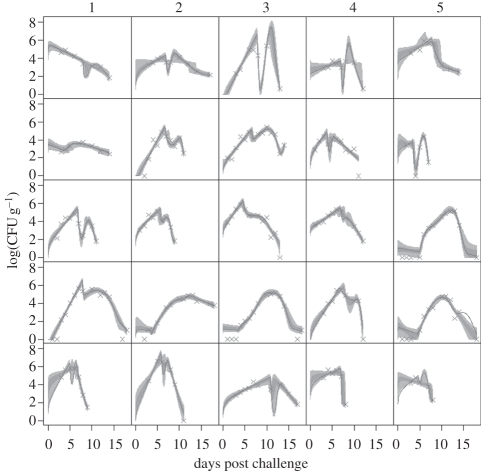
Figure 2.
Fits of the baseline model M0 to the observed shedding data (crosses) in all 25 cattle. The graphs show the log of the bacterial count on the surface of the faeces (in CFU g–1) against days post challenge. The solid lines give the best-fit solution, while the dark grey regions show the 50% posterior predictive intervals and the light grey regions show the 95% posterior predictive intervals of the model fit.

