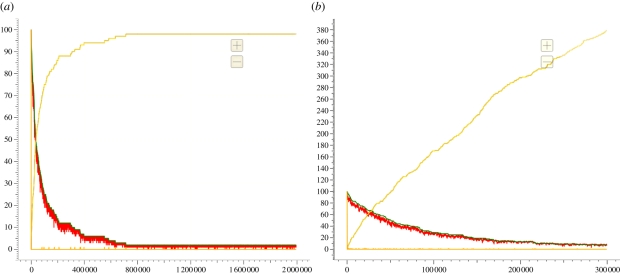
Figure 8.
Stochastic simulation plots of 100 copies of the buffered join gate, both with (b) leak reactions and (a) without. The red and green lines are the populations of the <hA t^ A> and <hB t^ B> input strands, respectively. The blue and yellow lines are the population of the <Ch t^ C> and <Dh t^ D> output strands (the populations of these are always identical). The darker orange line is the population of the trigger strands <B t^ K>, which initialize buffered gates on demand. The plot with leaks enabled is qualitatively different from the plot without leaks, suggesting that the unwanted inference is adversely affecting the behaviour of the system (see §3.3 for further discussion on how leak reactions affect the buffered join gate).

