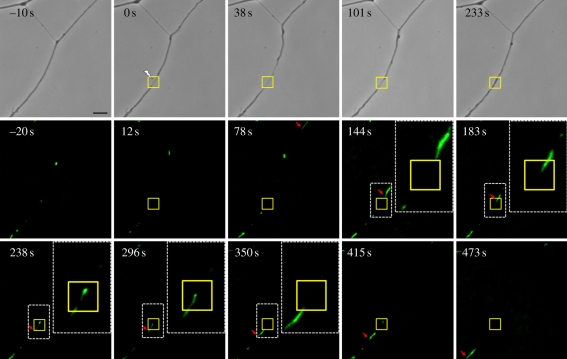
Figure 9.
Mitochondrial transport study using rhodamine 123 staining of a live axon subjected to laser irradiation. Phase contrast images (top row) before and immediately after laser damage, and time-lapse fluorescence images (middle and bottom rows) of rhodamine 123 staining of mitochondria at different time points. A mitochondrion was tracked (additional mitochondria in electronic supplementary material, movie S2, were tracked and analysed) to calculate the velocity of mitochondrial movement through the damage zone (square box). Arrows in the images at time 78–473 s indicate the position of the mitochondrion. A white box encloses the tracked mitochondrion near the laser-irradiated zone (square box) and a magnified view (inset) of the area containing the tracked mitochondrion are shown in the images at 144 s, 183 s, 238 s, 296 s and 350 s. From fluorescence images at time of 238 s and 296 s, it appears that the same mitochondrion stops moving in the damage zone within a period of about 1 min. However, from the phase contrast image at 233 s, the damage axon shaft appears to have regained its pre-irradiation thickness. Scale bar, 5 µm. (Online version in colour.)

