Figure 2.
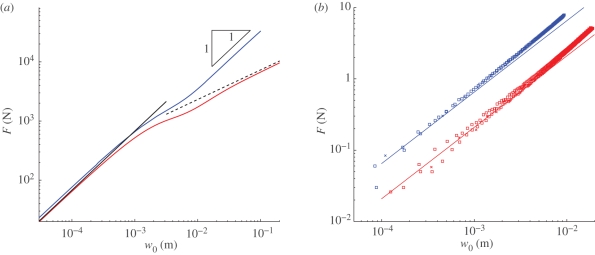
Force-displacement curves in indentation tests. (a) In the absence of a pressure difference, p = 0 (red curve) the numerical results recover the asymptotic results of Reissner [13] (solid line) and Pogorelov [14] (dashed line). However, with p = 105 Pa (blue curve), a new linear regime is observed at large displacements. Here, E = 70 GPa, v = 0.3, R = 1 m, h =2 mm. (b) Experimental results obtained with a Pezzi ball with internal pressure p = 1.2 kPa (red) and p = 5.4 kPa (blue). Results are shown for loading at a speed of 200 µm s-1 (squares) and unloading at 1000 µm s−1 (crosses). In each case, two runs are shown with every 20th point plotted. The lack of a significant discrepancy between repeated experiments demonstrates the reproducibility of our results as well as the unimportance of frictional and rate effects. The two solid lines represent the linear force laws F = k1 w0 with the appropriate value of k1 predicted by theory (see §3).

