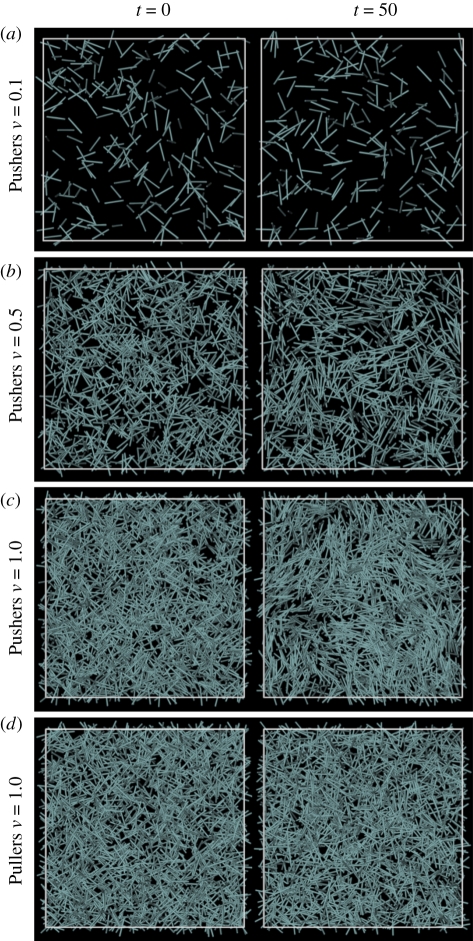
Figure 1.
Particle distributions at t = 0 (initial random distribution) and t = 50, in suspensions of Pushers at (a) ν = 0.1, (b) ν = 0.5, (c) ν = 1.0 and (d) in a suspension of Pullers at ν = 1.0. The simulations were performed in a cubic cell of linear dimension L = 10, but the above figures only show a section of dimensions 10 × 10 × 3. Also see the accompanying online movie (electronic supplementary material). (Online version in colour.)

