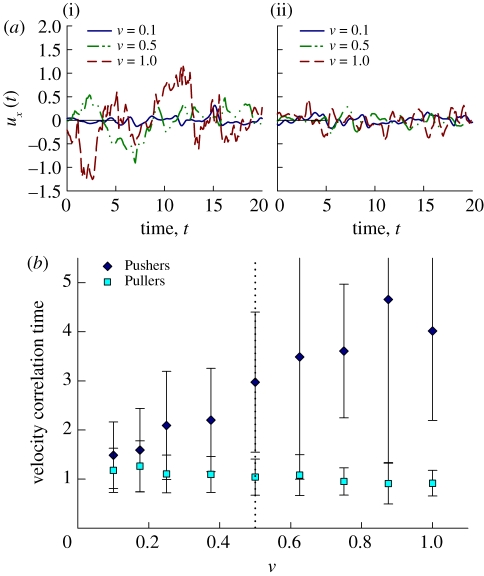
Figure 4.
(a) Sample time traces of the x component of the fluid velocity at an arbitrary spatial point in suspensions of Pushers (i) and Pullers (ii). (b) Velocity correlation time (mean value over many sample spatial points, with standard deviation error bars) versus effective volume fraction ν. The correlation time is defined as the position of the first minimum in a velocity time-trace autocorrelation. (Online version in colour.)

