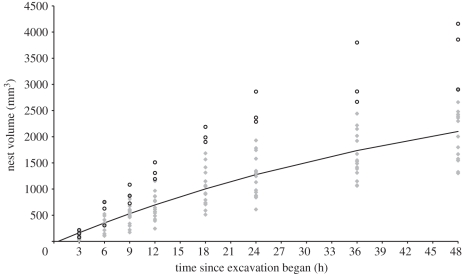
Figure 2.
Volumetric growth of ant nests over time. The data represent a total of 144 scans from the growth of 18 nests. The growth data from colony 6 were excluded from the analysis (open circles; see text). The recovery exponential model was fitted to the raw data using the parameters: K = 3500 mm3, T = 0.5 and assuming V0.5 = 1% V3 for each nest. This yields A = 0.019 and r2 = 0.74.

