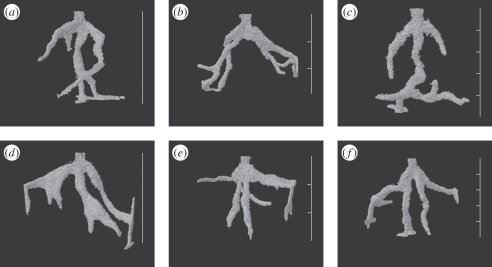
Figure 4.
Selected three-dimensional reconstructions of ant nests illustrating changes in tunnel direction at the positions of planes between layers of sediment in the 2P and 4P treatments and comparison with those from the same donor colony under the 0P treatment. (a) Colony 4 under the 0P treatment at 48 h. The nest has reached the bottom of the experimental container. (b) Colony 4 under the 2P treatment at 48 h. The nest has reached the edges and bottom of the experimental container. (c) Colony 4 under the 4P treatment at 48 h. The nest has reached the bottom of the experimental container. (d) Colony 5 under the 0P treatment at 48 h. The nest has reached the edges and bottom of the experimental container. (e) Colony 5 under the 2P treatment at 36 h. The nest has reached the edges of the experimental container. (f) Colony 5 under the 4P treatment at 48 h. The nest has reached the edges and bottom of the experimental container. Scale bars, 50 mm in total and divisions show the positions of the planes between layers.

