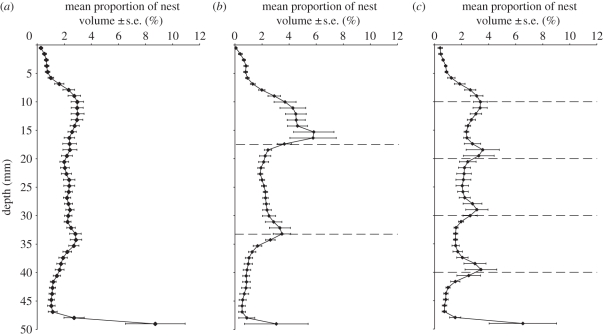
Figure 5.
Mean proportion of nest volume with depth at 48 h after excavation began. (a) Nests excavated under the 0P treatment. (b) Nests excavated under the 2P treatment. (c) Nests excavated under the 4P treatment. Dashed lines indicate the positions of the planes between layers of sediment. Each treatment consisted of six replicates with the same six donor colonies used across treatments in a repeated measures design.

