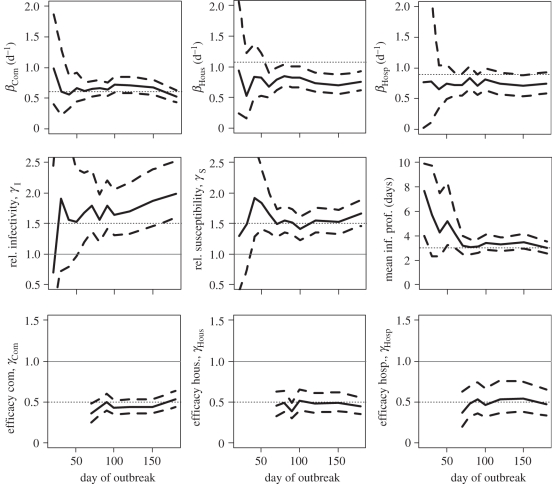
Figure 4.
Estimates of transmission rates and relative transmission risk factors as a function of the number of days since the outbreak started when 50% of cases are detected in the community and in the hospital, and when 90% of cases among household contacts of detected cases are detected. Solid line, posterior mean; dashed line, 95% credible interval; dotted line, simulation value. For parameters used to compare groups (e.g. relative susceptibility, efficacy of interventions, etc.), we have also added a thin horizontal line y = 1. Top row gives estimates of the transmission rates in the different settings. Middle row gives estimates of the relative infectivity and relative susceptibility of children and the mean duration characterizing the infectivity profile. Bottom row gives the estimates of the efficacy of intervention to reduce transmission rates in the different settings.

