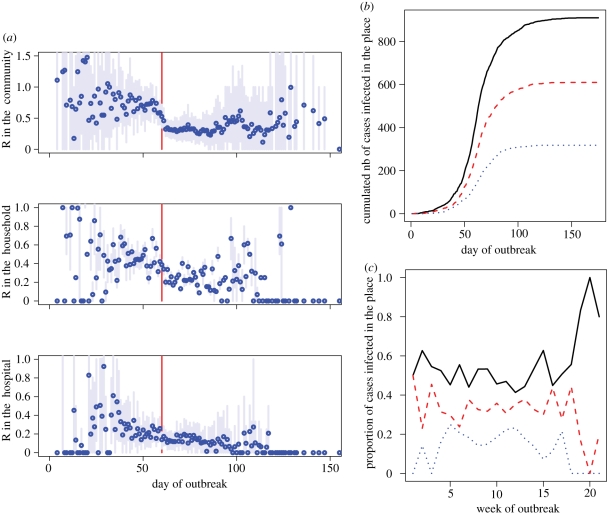
Figure 5.
Summary statistics derived from the tree reconstruction. (a) Disaggregated monitoring of the reproduction number in the community, the household and the hospital based on the reconstructed transmission tree. Blue point, posterior mean; light blue line, 95% credible interval; red line, time when control measures were implemented. (b) Reconstructed cumulated number of cases infected in the different settings. (c) Reconstructed weekly proportion of cases infected in the different settings. (b,c) Solid line, community; dashed line, household; dotted line, hospital.

