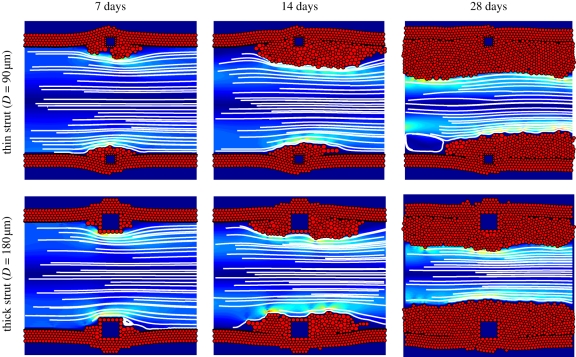
Figure 2.
Simulation results for the thin strut (D = 90 µm) and the thick strut (D = 180 µm), both deployed to a depth of 90 µm, at 7, 14 and 28 days after stent deployment. The SMCs are shown as red circles and the square struts as blue squares surrounded by red obstacle agents. In the lumen, blood flow is visualized by streamlines, and the colours represent the shear stress, ranging from 0 Pa (dark blue) to 60 Pa (dark red).

