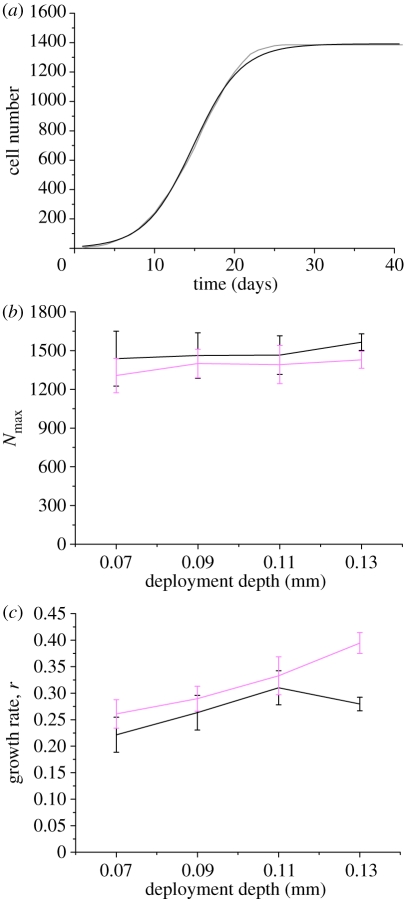
Figure 3.
(a) Nonlinear logistic curve-fitting of neointimal cell number from a thick strut (D = 180 µm; grey line) deployed at a depth of 90 µm. Logistic fit represented as black line. (b) Curve-fitting parameters Nmax and (c) growth rate ‘r’ are plotted with respect to different deployment depths for both strut sizes. Black line, D = 90 µm; pink line, D = 180 µm.

