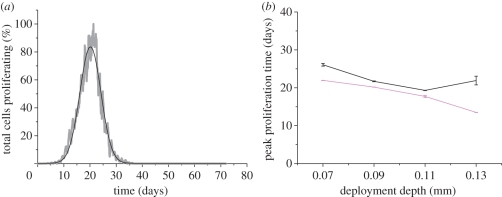
Figure 4.
(a) Normalized peak proliferation curve from the thick strut (D = 180 µm; grey line) deployed at 90 µm. The fitted Gaussian curve (black line) highlights the time at which maximum proliferation occurred. (b) Peak proliferation time plotted against deployment depth for both strut sizes. Black line, D = 90 µm; pink line, D = 180 µm.

