
Figure 6.
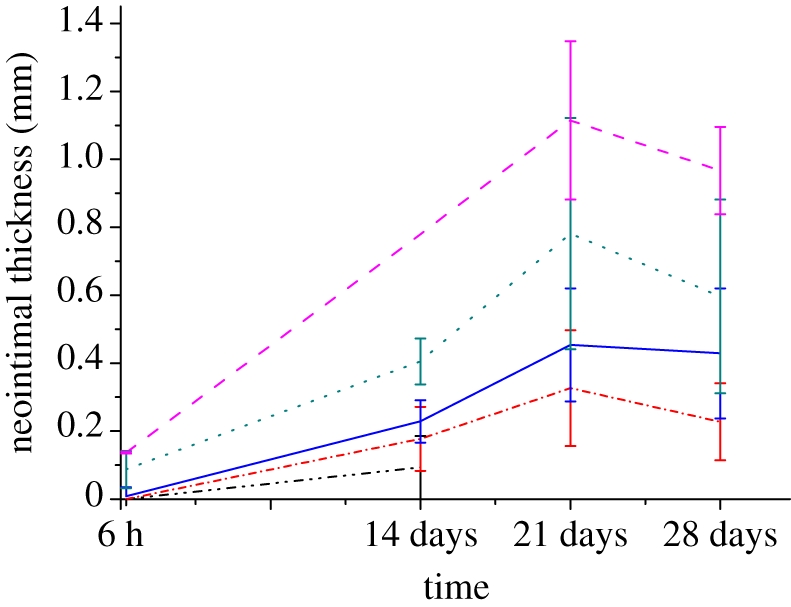
Neointimal thickness as a function of time after stent deployment. The mean and standard deviation of the neointimal measurements are plotted at 6 h, 14, 21 and 28 days post-stent deployment. The data show a positive correlation between neointimal thickness and the Gunn injury scores. Black dashed-dotted line, injury score 0; red dashed-dotted line, injury score 1; blue solid line, injury score 2; green dotted line, injury score 3; pink dashed line, injury score 4.