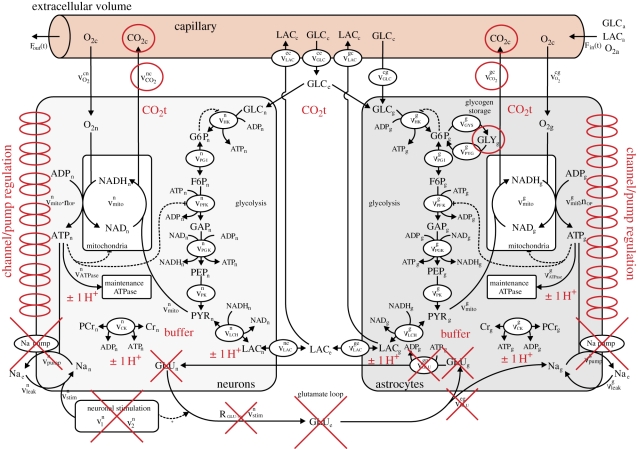
Figure 1.
Diagram representing the Cloutier et al. model [30] with, in red, the modifications allowing the computation of pH dynamics in brain cells. Modifications include: the addition of a pH buffer represented by the word ‘buffer’, generation or consumption of H+ associated with ATPase, phospocreatine–creatine dynamics and LAC represented by ‘±1 H+’, the addition of seven ion channels or pumps associated with the regulation of pH represented by double ellipses on the left of the neurons compartment and on the right of the astrocytes compartment. Red circles indicate modifications of CO2 or glycogen dynamics. Red crosses indicate the suppression of elements related to glutamate dynamics.

