Figure 5.
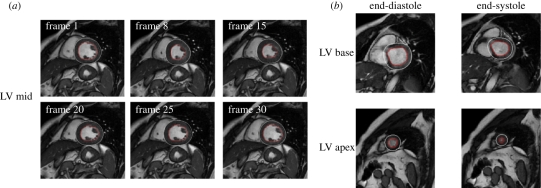
Examples of (a) the detected endocardial (in red) and epicardial contours in a slice at mid-ventricular level, in the same frames throughout the cardiac cycle and (b) in a slice at basal and apical levels at end-diastole and end-systole. At basal levels, manual correction was often needed, as shown in this example by the misplacing of the epicardial contour.

