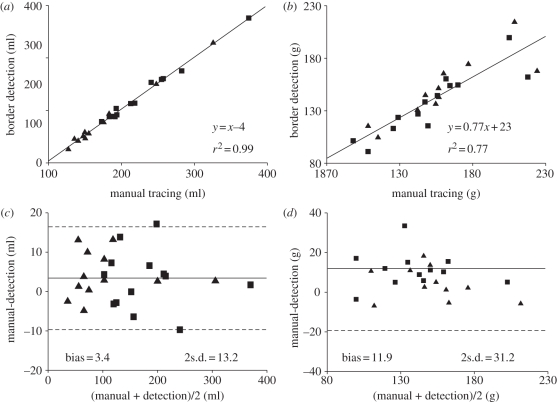
Figure 6.
Linear correlation and Bland–Altman analysis of the results of (a, c) LV volumes and (b, d) mass (with end-diastolic, squares, and end-systolic, triangles, measurements considered together) obtained by manual tracing of CMR images (gold-standard) and through application of the developed endocardial and epicardial border detection algorithm.

