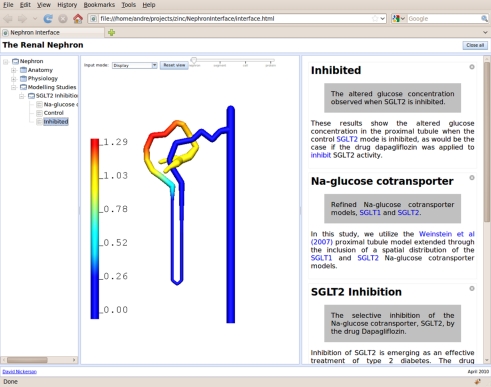
Figure 3.
An illustration of the user interface presenting a field-based visualization of simulation results from one of the modelling studies included in the comprehensive model description. In this example, the visualized field is showing the relative concentration of glucose in the lumen of the proximal nephron with the non-dimensional scale shown on the left in the graphical view panel (centre screen).

