Figure 1.

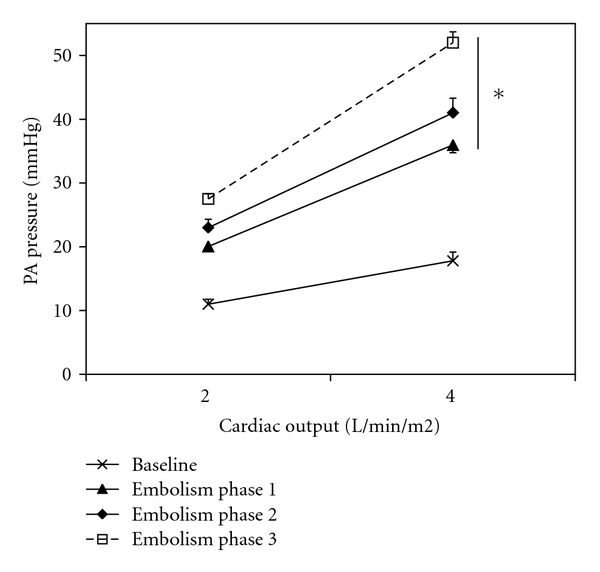
Pulmonary arterial (PA) pressure versus cardiac output plots at baseline and after pulmonary embolism (highest level) (mean ± s.e.m, n = 10). Pressure-flow plots shifted upwards with embolism. *P < .05 versus baseline.

Pulmonary arterial (PA) pressure versus cardiac output plots at baseline and after pulmonary embolism (highest level) (mean ± s.e.m, n = 10). Pressure-flow plots shifted upwards with embolism. *P < .05 versus baseline.