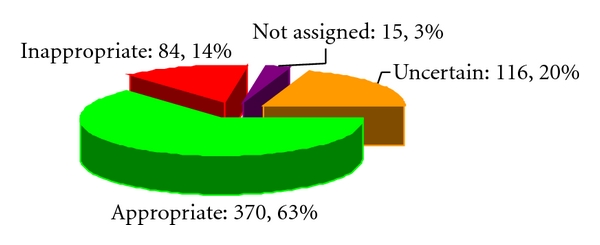
Figure 1.

Distribution of studies in each of the appropriateness categories. Appropriate (green), uncertain (gold), inappropriate (red), not assigned (purple). Numbers of patients in each category and percent of all patients (rounded to the nearest whole value) are shown next to the corresponding symbols.
