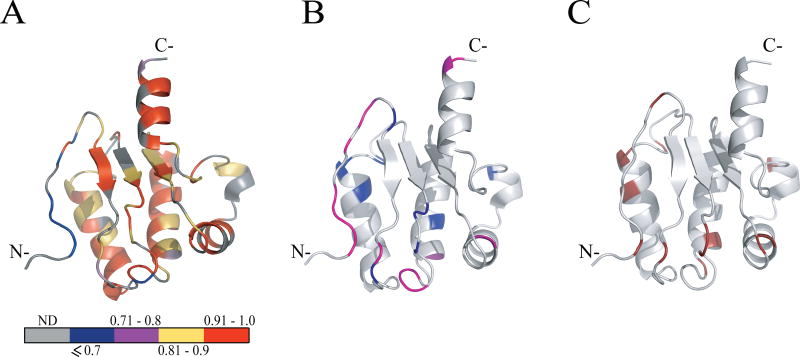
Fig. 3.
Model-free parameters mapped onto the ribbon representation of Rv1739c STAS. (A) Values of generalized order parameters (S2) are highlighted for each residue as follows: blue, S2 ≤ 0.7; magenta, 0.71 ≤ S2 > 0.8; yellow, 0.81 ≤ S2 > 0.9; red, 0.91 ≤ S2 > 1.0; gray, data unavailable (ND). (B) Values of effective correlation times (τe) for each residue: light magenta, residues experiencing faster motions (τe ≤ 100 ps); blue, residues experiencing slower motions (τe > 100 ps). (C) Residues with exchange terms (Rex) that account for conformational and/or chemical exchange are dark red. In (B) and (C), STAS ribbon structure is light gray (“hydrogen” in the PyMOL carbon pseudocolor scheme).

